Authors:
(1) Scott Conn, California Institute of Technology, Pasadena, California;
(2) Joseph Fitzgerald, California Institute of Technology, Pasadena, California;
(3) Jorn Callies, California Institute of Technology, Pasadena, California.
Table of Links
4. Results
a. Case Study: Fall Event
We begin with a detailed analysis of the simulation results for event 1, which occurred in the fall (Fig. 1c). This event is by far the most energetic NIW event observed throughout the year. The main
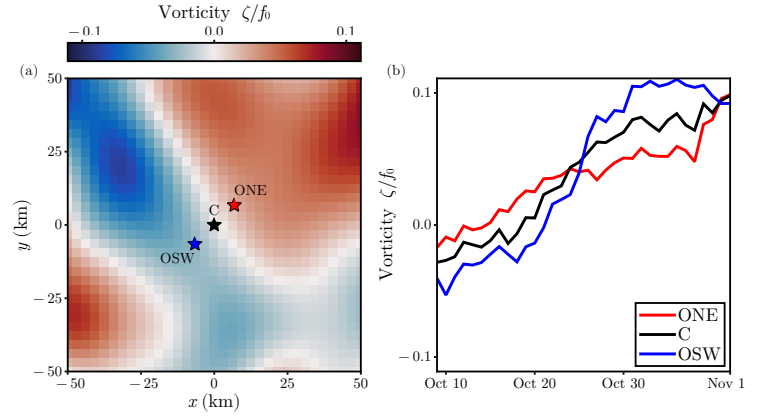
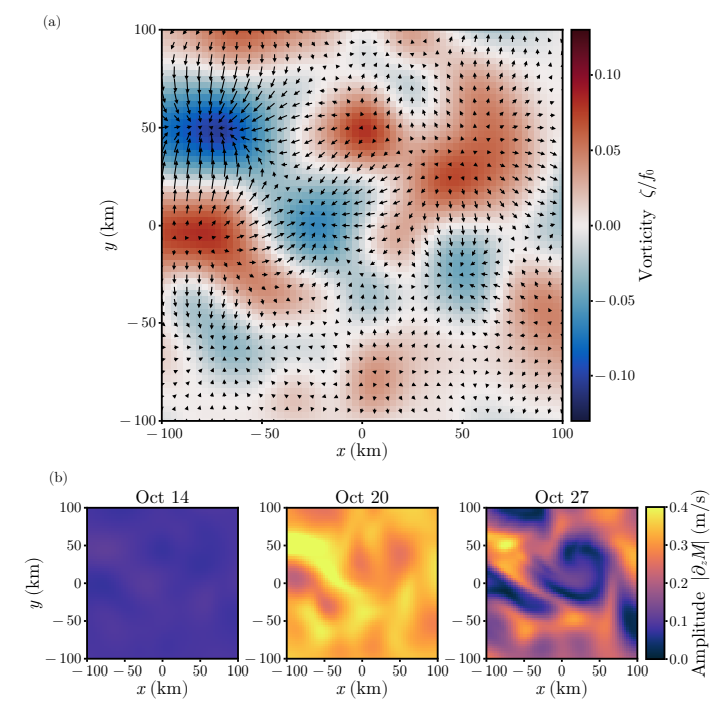
forcing for event 1 occurred when the mooring array straddled a dipole in the mesoscale vorticity (Fig. 2), making it a good candidate to see the effect of 𝜁-refraction.
- NIW Amplitude and Phase
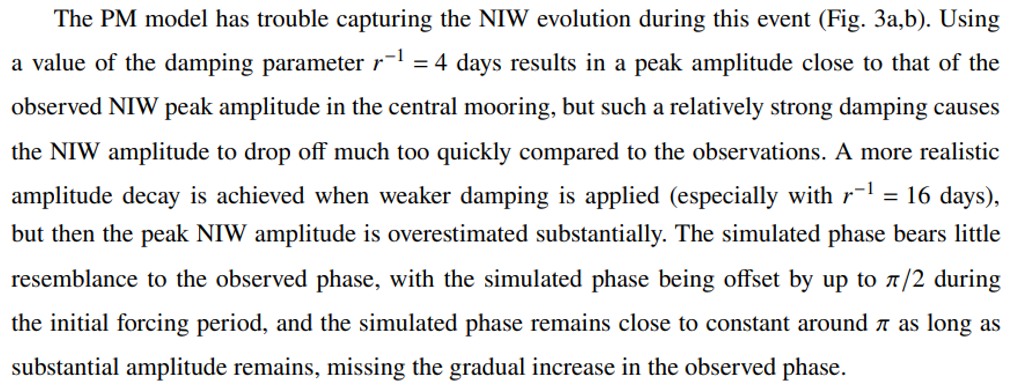
The observed NIW amplitude begins increasing around Oct. 14 and reaches a maximum value on Oct. 20 before returning to background levels by the end of our simulation period on Nov. 10 (Fig. 3a). There are large variations in the peak amplitude over the mooring array, although these differences disappear by the end of the event (Fig. 3c).
The phase increases sharply near the beginning of the forcing period as it aligns with the wind (Fig. 3b). Following this, it slowly increases for most of the event and is relatively homogeneous across the mooring array except for a period following the initial forcing (Fig. 3d).
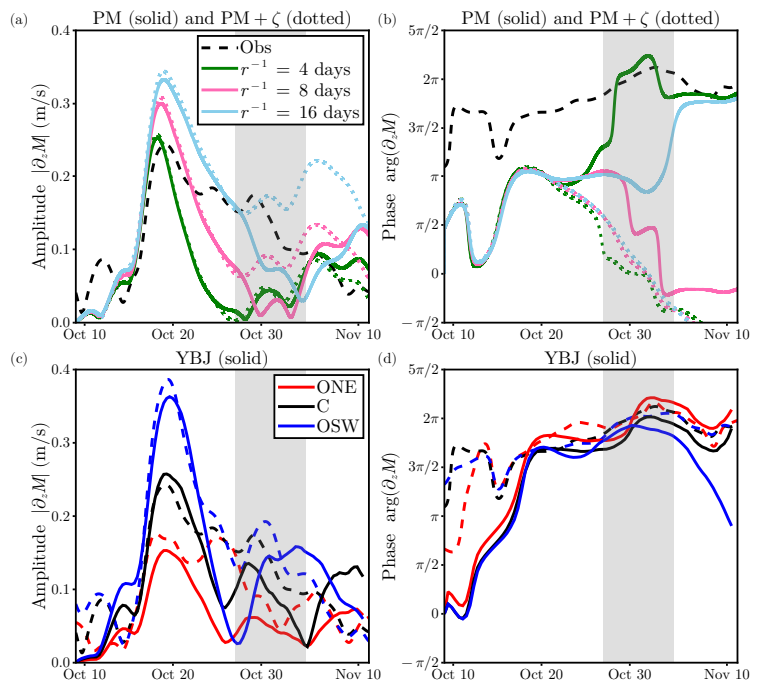
The addition of the refractive term does little to change the simulated NIW amplitude in the PM model during most of the event (Fig. 3a,b), indicating that the phase shifts introduced by refraction are unable to substantially change the relative alignment between the NIWs and the winds.
At later times the effect of adding refraction is more pronounced in the runs with lower damping as there is more time for refraction to act on the waves before they are dissipated. Refraction seems to dominate the phase evolution at all three damping values, but the phase trends in the opposite direction from what is observed. The phase tendency is also larger in magnitude than what is observed.
While the PM model may be able to capture some qualitative features of the NIW observations, it seems clear that: (i) the physical processes that cause the NIWs amplitude to decay cannot be accurately captured using a simple linear drag formulation, and (ii) if refraction is important to NIW evolution, its effect is not simply to change the phase of the NIWs but must involve horizontal processes.
The YBJ model captures the observed amplitude and phase evolution much better than the PM model (Fig. 3c,d). At the central mooring, the YBJ simulation agrees with observations in terms of peak amplitude and decay timescale. Similarly, the phase evolution is much closer to observations than the PM results, in terms of both its value after the forcing and its trend afterward. Again, we emphasize that, unlike the PM models, there is no tunable parameter in the YBJ simulations.
The YBJ model also captures observed lateral variations of the NIW signal across the mooring array (Fig. 3c,d). At the OSW mooring, which at the start of the event is in a region of anti-cyclonic vorticity (Fig. 2), the YBJ simulation successfully predicts a substantial enhancement in the NIW amplitude compared to the central mooring.
At the ONE mooring, which at the start of the event is in a cyclonic region (Fig. 2), the YBJ simulation successfully shows a reduction in the NIW amplitude compared to the central mooring. The YBJ model also captures that the NIW phase is much more uniform across the mooring array than the amplitude.
2) NIW kinetic energy Budget
The observations show a higher NIW amplitude at the mooring in the anticyclone than at the mooring in the cyclone (Fig. 3c,d). This is suggestive of 𝜁-refraction concentrating NIW kinetic energy in anticyclones. It is hard to draw this conclusion from the observations alone, however, because other factors could give rise to the observed amplitude differences. For example, the current meters were located at slightly different depths (between 𝑧 = −44 m and 𝑧 = −62 m).
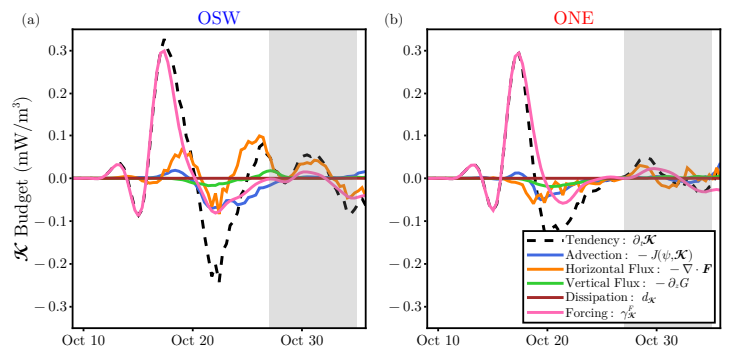
With the YBJ simulations capturing the observed differences between the moorings, we can use the YBJ framework to identify the processes giving rise to these lateral variations. We construct a point-wise kinetic energy budget (4) at the OSW (anticyclonic region) and ONE (cyclonic region) moorings, which allows us to separate the kinetic energy tendency into advection, dispersive flux divergence, dissipation, and forcing (Fig. 4). During the initial forcing period (up to Oct. 20), the tendency due to wind forcing is similar for both moorings.
At both locations, there is a small positive advective tendency that turns slightly negative toward the end of the forcing period. The vertical flux divergence is also similar at the two locations and smaller in magnitude than the advective
tendency. Dissipation is negligible. The most notable difference between the two mooring locations is in the horizontal flux divergence term. There is horizontal flux convergence at the OSW mooring and flux divergence at the OSE mooring. This causes the total tendency to be larger than the wind forcing at the OSW mooring and smaller than the wind forcing at the ONE mooring.
At these early times, 𝜁-refraction is the primary driver of the horizontal energy flux and causes concentration of NIW kinetic energy into anticyclonic regions. During the peak of the event, the horizontal energy flux is directed from cyclonic to anticyclonic regions (Fig. 5a). This arises from an interplay of the refraction and dispersion terms in the YBJ dynamics: refraction sets up phase gradients, which cause a dispersive energy flux as described by (5).
As horizontal structure develops, advection can also become important as it stirs the existing horizontal structure. This sequence of events was described by Rocha et al. (2018) and captures the early evolution during this event (Fig. 5b).
We again emphasize that the PM model, even if the refractive term is included, cannot capture these dynamics because lateral energy transport originating from the dispersion term in the YBJ equation is crucial. Once dispersion is included, the YBJ model captures observed lateral variations in the NIW amplitude between anticyclonic and cyclonic regions and offers a clear dynamical explanation.
3) NIW potential energy Budget
The NIW potential energy budget is of interest because it provides insight into the energy exchange with mesoscale eddies (Xie and Vanneste 2015; Rocha et al. 2018). While we prescribe the mesoscale eddy field using altimetry rather than evolving a coupled system, we still interpret the sources of NIW potential energy as estimates of the energy transfer from mesoscale eddies facilitated by NIW refraction and advection.
The vertically integrated and domain-averaged budget for event 1 shows that NIW potential energy is generated by both refraction and advection (Fig. 6). The potential energy tendency rises sharply from zero to a peak value after the main forcing period of the event, lagging the peak in the kinetic energy tendency by a few days.
At these early times, almost all of the NIW potential energy is created by refractive production. As horizontal structure is created, advective production ramps up. The refractive production term decreases throughout the rest of the event and by the end is
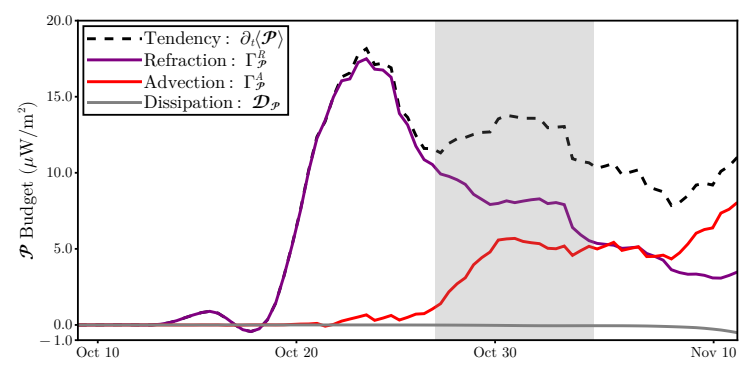
overwhelmed by advective production. The initial dominance of refractive production followed by an increase in advective production is very similar to the succession of events Rocha et al. (2018) described for stimulated generation in idealized simulations that included the full coupling with the mesoscale dynamics.

4) NIW Wind Work
b. Further Events in the Time Series
Simulations of the remainder of the NIW events (Fig. 8) confirm that the YBJ model better captures the observed NIW amplitude and phase evolution than the PM model does (Fig. 8). Event 4 is different from the others in that it consists of a double peak in NIW amplitude without a decay to background levels in between.
The mixed layer depth was much more variable than during other events, especially towards the end of the event. For that reason, we simulate event 4 in two parts (events 4a and 4b) in order to minimize the variations in the mixed layer depth over a simulation period.
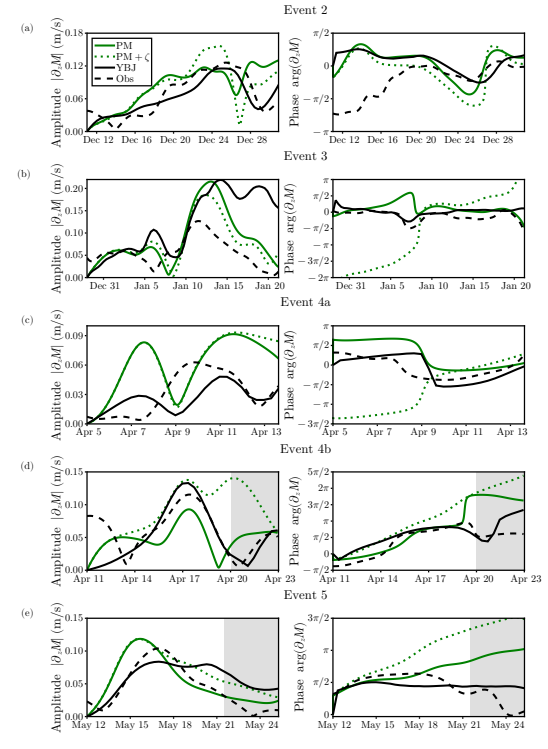
In general, we see that the YBJ model performs better than the slab models in reproducing the observed evolution of the NIW amplitude and phase. In event 2, the YBJ model captures the slow rise of the NIW amplitude as well as the decrease at late times. The PM models are not able to capture this behavior as well (Fig. 8a). All of the models, however, have substantial errors in the phase at early times.
This could be due to pre-existing NIWs that we do not capture because we initialize the models at rest. The notable exception to the trend that YBJ performs better than the PM models is event 3 (Fig. 8b), where the YBJ model not only overestimates the peak but also the decay time of the waves. YBJ does, however, capture the slow evolution of the phase better than the PM models.
We discuss some of the potential reasons for these disagreements below. For event 4a, all models predict a double peak in the amplitude that is not seen in observations (Fig. 8c). The YBJ model does better at later times in both amplitude and phase. In event 4b, the YBJ model does rather well in predicting the complete evolution of both the NIW amplitude and phase (Fig. 8d). The YBJ model predicts the timing of the peak better than the PM models in event 5, but the waves persist for longer than observed (Fig. 8e).
This paper is available on arxiv under CC 4.0 license.

